Tracking the right performance metrics is the difference between maximizing your rental income and leaving thousands of dollars on the table each year.
Key Financial Metrics Every Property Owner Must Track
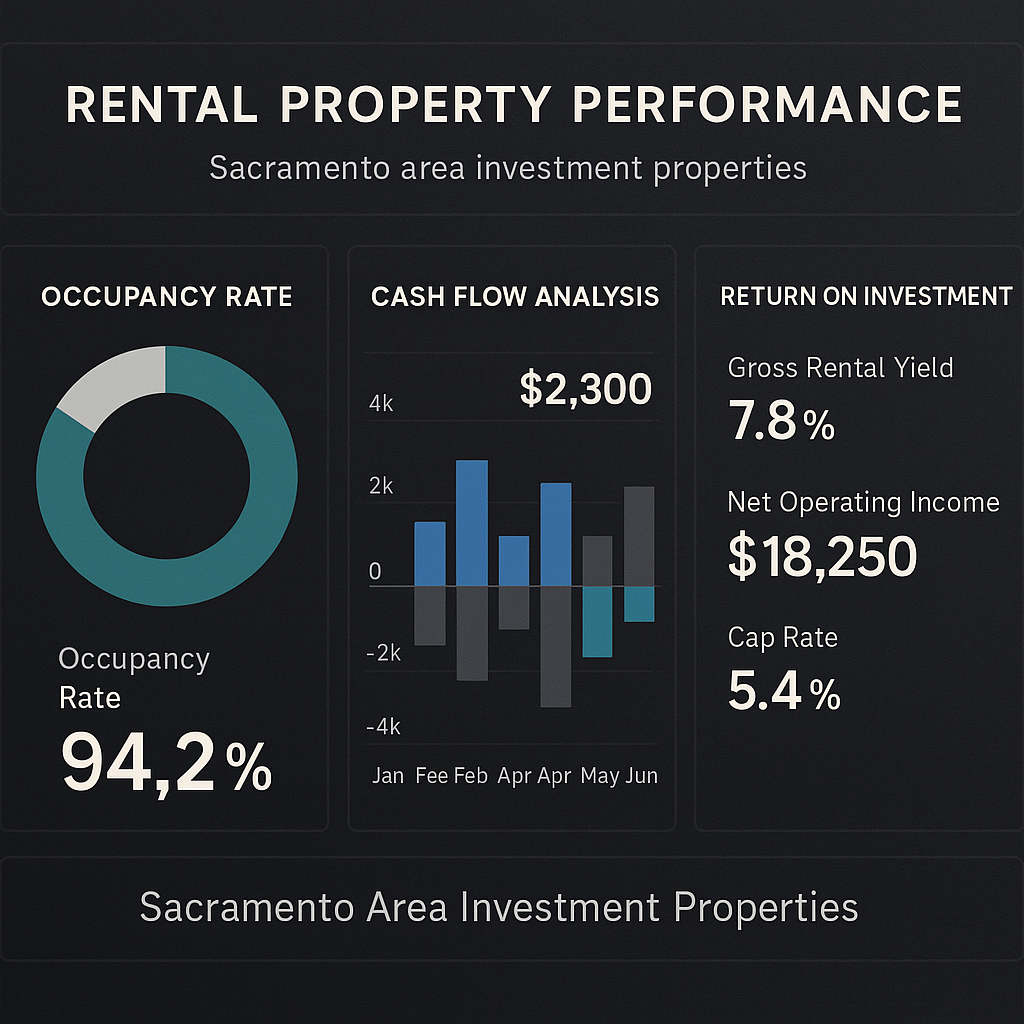
Successful rental property investment demands rigorous financial oversight and a comprehensive understanding of core performance indicators. The most critical metric for any rental property owner is the Net Operating Income (NOI), which represents total rental revenue minus all operating expenses, excluding debt service and capital expenditures. This figure provides a clear snapshot of your property's operational profitability and serves as the foundation for calculating your capitalization rate—a key benchmark for evaluating investment performance relative to market standards.
Cash-on-cash return represents another essential metric, measuring the annual pre-tax cash flow against the total cash invested in the property. This calculation accounts for mortgage payments and provides investors with a realistic assessment of actual returns on invested capital. In the Sacramento market, where property values and interest rates fluctuate, monitoring this metric quarterly enables property owners to make informed decisions about refinancing opportunities or portfolio reallocation strategies.
Gross Rent Multiplier (GRM) and the Operating Expense Ratio (OER) round out the fundamental financial metrics every landlord must monitor. The GRM—calculated by dividing property price by gross annual rental income—offers a quick comparative analysis tool for evaluating acquisition opportunities or current property valuations. Meanwhile, the OER, which expresses operating expenses as a percentage of gross operating income, should typically range between 35-45% for well-managed residential properties. Deviations from this benchmark warrant immediate investigation into cost management practices and operational efficiency.
Occupancy Rate and Vacancy Loss Analysis
Occupancy rate stands as one of the most transparent indicators of rental property performance, yet many property owners fail to calculate it with sufficient precision. True occupancy measurement extends beyond simple tenant presence—it must account for economic occupancy, which factors in rent collection rates, concessions, and payment delinquencies. A property showing 95% physical occupancy but experiencing consistent late payments or partial rent collection may actually operate at 88% economic occupancy, significantly impacting cash flow projections and overall investment returns.
Vacancy loss represents a direct erosion of potential rental income and demands comprehensive analysis beyond surface-level statistics. In the Sacramento rental market, average vacancy rates fluctuate between 4-7% depending on property type, location, and seasonal factors. However, the true cost of vacancy extends well beyond lost rent—it encompasses turnover expenses including marketing costs, cleaning, repairs, potential rent concessions, and the administrative burden of tenant screening and lease execution. A single 60-day vacancy on a property generating $2,000 monthly rent translates to $4,000 in lost revenue, plus an average of $1,500-3,000 in turnover costs.
Proactive vacancy mitigation requires systematic lease renewal management and strategic tenant retention initiatives implemented 90-120 days before lease expiration. Property owners should maintain detailed records of average days-to-lease for their properties, comparing this metric against local market benchmarks. Properties consistently exceeding market averages for vacancy duration indicate underlying issues—whether pricing misalignment, property condition concerns, ineffective marketing strategies, or inadequate tenant screening processes that result in problematic tenancies requiring early termination.
Tenant Retention as a Performance Indicator
Tenant retention rate serves as a leading indicator of property management effectiveness and long-term investment sustainability. Properties maintaining tenant retention rates above 70% typically demonstrate superior financial performance, as the cost differential between retaining existing tenants and securing new ones ranges from $1,500 to $3,500 per turnover event. This calculation encompasses lost rent during vacancy periods, rehabilitation expenses, marketing costs, screening fees, lease administration, and the opportunity cost of management time diverted from value-adding activities to turnover processing.
Analyzing tenant retention patterns reveals critical insights into property performance and management quality. Systematic tracking should include average tenancy duration, renewal acceptance rates, and the reasons cited for non-renewals. Properties experiencing tenant departures primarily due to relocation or life circumstances generally indicate satisfactory management performance. Conversely, patterns showing tenants leaving due to maintenance responsiveness issues, communication breakdowns, or competitive pricing pressures signal operational deficiencies requiring immediate remediation.
Implementing formal tenant satisfaction assessments and proactive maintenance programs directly correlates with improved retention metrics and enhanced property performance. Sacramento-area properties that conduct semi-annual tenant satisfaction surveys and address concerns promptly demonstrate retention rates 15-25% higher than properties employing reactive management approaches. Additionally, strategic lease renewal incentives—such as minor upgrades, flexible lease terms, or modest rent increase deferrals—often prove more cost-effective than absorbing full turnover expenses while simultaneously reducing vacancy risk and preserving consistent cash flow.
Maintenance Costs and Operating Expense Ratios
Maintenance expenditures represent one of the most variable and controllable components of rental property operating expenses, yet inadequate tracking and analysis of these costs undermines profitability for countless property owners. Industry benchmarks suggest that routine maintenance and repairs should consume approximately 1-2% of property value annually for newer properties, escalating to 3-4% for properties exceeding 20 years of age. However, these figures mask significant variation based on property condition, tenant quality, preventive maintenance practices, and regional factors affecting material and labor costs.
The Operating Expense Ratio (OER)—calculated by dividing total operating expenses by gross operating income—provides a comprehensive metric for evaluating overall cost management effectiveness. For residential rental properties in the Sacramento market, a well-managed property typically maintains an OER between 35-45%, with variations depending on property type, age, and included utilities. Properties consistently exceeding 50% OER warrant comprehensive operational audits to identify cost inefficiencies, vendor pricing concerns, or systemic maintenance issues resulting from deferred capital improvements or problematic tenant behaviors.
Distinguishing between routine maintenance expenses and capital improvements proves essential for accurate performance assessment and tax planning. Routine maintenance—including repairs, painting, landscaping, and minor replacements—represents operational expenses deductible in the year incurred. Capital improvements—such as roof replacement, HVAC system installation, or significant structural modifications—must be depreciated over extended periods. Property owners should maintain detailed maintenance logs categorizing all expenditures, tracking cost trends across comparable periods, and benchmarking per-unit maintenance costs against portfolio averages and market standards. Properties demonstrating maintenance costs exceeding 150% of portfolio averages require immediate investigation to determine whether tenant selection issues, property condition deterioration, or vendor management inefficiencies drive excessive expenditures.
Comparing Your Property Performance to Market Benchmarks
Contextualizing individual property performance against relevant market benchmarks transforms raw data into actionable intelligence that drives strategic decision-making and portfolio optimization. Sacramento-area property owners should regularly compare their properties against multiple benchmark categories: geographic submarkets (specific neighborhoods or ZIP codes), property types (single-family residences, multi-family units, condominiums), age cohorts, and price segments. This multi-dimensional benchmarking approach reveals whether performance variations stem from property-specific factors or broader market dynamics affecting entire segments.
Rental rate analysis represents the most fundamental comparative metric, yet effective evaluation extends beyond simple price-per-square-foot comparisons. Comprehensive rent benchmarking must account for property condition, amenities, location attributes, lease terms, and included utilities. Properties priced 10-15% below comparable market rates indicate either below-market positioning that sacrifices potential income or underlying property deficiencies that necessitate discounted pricing to maintain occupancy. Conversely, properties commanding premium rents above market averages should demonstrate superior tenant retention and minimal vacancy periods—otherwise, pricing adjustments may optimize overall financial performance by reducing turnover frequency and vacancy duration.
Accessing reliable market data requires engagement with multiple information sources, including local property management firms, real estate associations, public rental listing platforms, and professional market research services. All Inclusive Realty Group provides Sacramento property investors with quarterly market analysis reports incorporating comparative occupancy rates, average rent trends, days-on-market statistics, and operating expense benchmarks specific to property type and location. Property owners conducting annual performance reviews using comprehensive market data consistently identify opportunities for rent optimization, cost reduction, and strategic capital improvements that enhance competitive positioning and long-term investment returns. Properties performing below market benchmarks across multiple metrics may benefit from professional property management services that leverage market expertise, vendor relationships, and systematic operational processes to elevate performance to market standards or above.
This content is for informational and educational purposes only. It does not constitute an offer or solicitation to buy or sell any security or investment product. Past performance and market trends do not guarantee future results. Consult a licensed financial advisor before making investment decisions. All Inclusive Realty Group, Inc. DRE #02005619.